Step 7: Cost Items
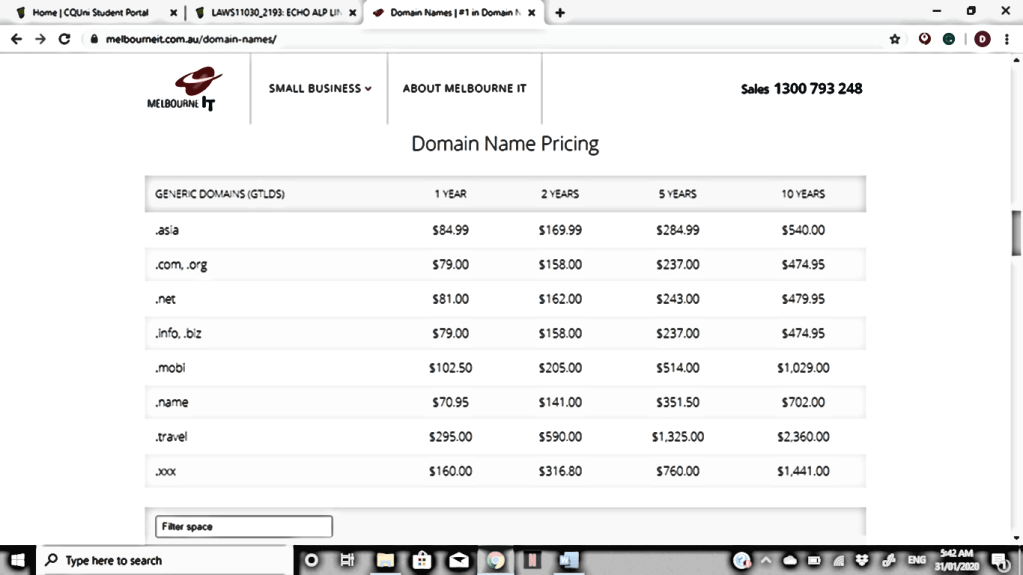
For my first item I chose the domain name registry, specifically the .net generic domain and for 2 years. A domain name is the identity string for the realm that the website is hosted in. for example ‘.com.au’ is obviously for Australian websites.
Domain name registry pricing: 2 years for $162.00 + $30 ongoing service fee p.a.
Variable costs = $30+$20=$50
Contribution margin = (162+30) – 50 =$14
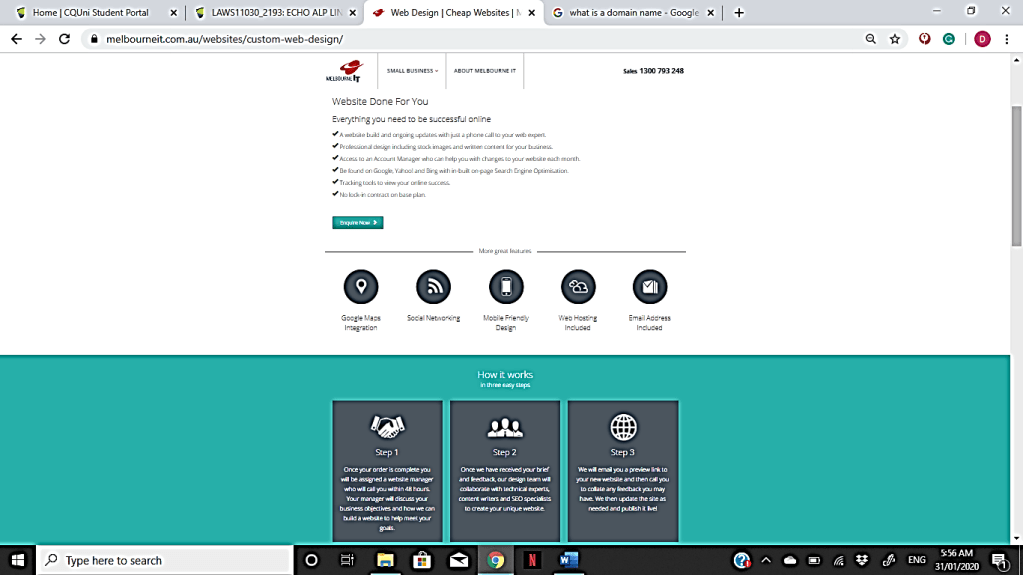
My second item is hard to find a price for, so I just googled how much it costs for a basic website build.
Website design: $500 + $20 ongoing maintenance fee
Variable costs = $300 + $10 = $310
Contribution margin = 520–310= $210
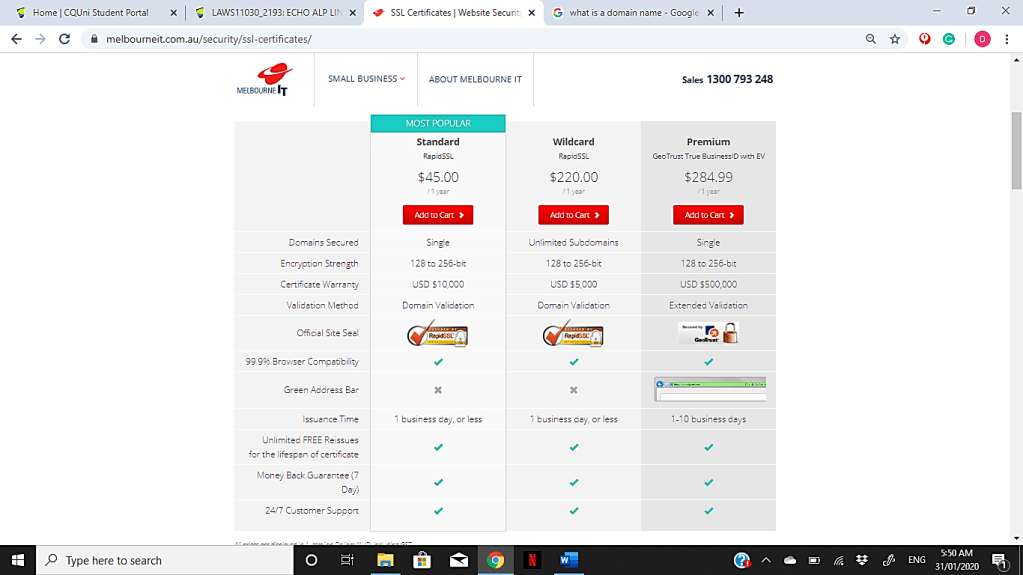
For my last item I chose to use the website security, I have opted for the most popular option at $45. It is the only item in my chosen, that doesn’t have an ongoing service fee.
Website security: $45 per year
Variable costs= $15 for labour on maintenance.
Contribution margin = 45-15= $30
Estimating or guessing how much the products of Melbourne IT would worth was challenging. Melbourne IT provide services, online services, which is something I have never even come across or had to use in my personal life. Luckily, after shifting through the website I managed to find how much they charge for ‘Website security’ and ‘Domain name registry’. I had to google how much it costs to have a website designed though, because they only had a quote option on the Melbourne IT website. I assumed that around $500, with and ongoing maintenance fee, for a medium range website build would be enough for this assessment.
As people don’t want to use multiple different services for their website design and build, Melbourne IT offer a one stop shop for all the design and hosting needs. It is the biggest benefit for tech companies, such as Melbourne IT because not many people understand how or what goes into building a website. The constraints that companies like Melbourne IT would face would also be in the fact that people don’t know what goes into the website design, meaning that consumers would be more likely to go to a company that charges less. Not only this but not understand why they need website security, would be another factor, especially, if they are not very tech savvy. My husband works for a big international company as an ATM Technician, recently they had a Russian Ransomware take over the whole company from Spain to Australia. If consumers don’t have sufficient security, it could have detrimental effects.
To me the contribution margin is the sum left after all the variable costs have been deducted. The contribution margin is where all the fixed costs must be deducted from, with the left-over amount being the sum of actual profit. Seeing as I don’t think that Melbourne IT would have many variable costs due to the services that they provide.
It has been tricky to separate the variable from the fixed costs for this company as the only variable costs I could think of is labour. All the other costs are licences, the computers used and electricity. Even when I estimated the variable costs and attributed most of them to labour alone, I’m not even sure if registering a domain name needs anyone to set it up or if it would even take much time at all. The reason that Melbourne IT would have quite similar variable costs is due to the nature of their services. They offer ongoing upkeep for a yearly fee. It would be quite like Telstra Broadband but without the inventory of modems. One of the benefits to providing services alone, would be that they would offer a few options for most of their services, like Telstra does. I noticed this for both the Website security and the domain name registry. This would be easier because once they sell these services, they know exactly how much profit, fixed and variable costs would be attributed to each one. Estimating the website build would be the problematic service. I am assuming that they would have a few basic options, where you could add specific items that you want to feature on your website. It would take a lot of consulting because people change their minds frequently and really have little to know idea what is involved in the service. One another note, the biggest benefit to providing services alone, is in the lack of inventory. Melbourne IT’s biggest expenses would be in the labour and quite possibly the top computers needed to service the tech support. The downside would be the massive amounts of cloud storage that would be needed to store the personal data of their clientele, also the very simple issue of natural disasters wiping out your electricity, software and cloud storage.
Step 8: Ratios
I personally didn’t find the ratios difficult to work out at all, I was very glad when I got to the end of Maria’s video and didn’t have to make sure everything totalled up correctly. The first thing that I have noticed about the ratios of my firm, is that they all follow a very specific trend. The company was improving gradually throughout all the years, except for 2018, this would be exactly the time when they merged under the ARQ Group. This has had a massive impact on the firm, and it is still too early to tell if it will be beneficial or detrimental in the long run.
Profitability Ratios
The net profit margin increased significantly from 8.6% up to 13%, in 2018 though it reduced rapidly down to -1.8%. The negative figure for 2018 is a concern, but with the merger that year it is difficult to tell if it is detrimental or just a probable outcome under the circumstances. Equally so, the Return on Assets also followed the exact same pattern, with an increase to almost 2% then an incredible drop to -0.7% in 2018.
Efficiency Ratios
There was no inventory that I could find for Melbourne IT and I am inclined to believe this because they focus solely on online services, it would be unlikely that they would carry inventory. I did read through the financial statements to be sure but could not find anything that appeared to represent inventory. The Total Asset Turnover has, on the other hand, increased for the year of 2018, it is only up by 0.05c but this is a completely different trend to the other ratio items. Total revenue did increase in 2018, as did the total assets. This is most likely because of the increase in total current assets for 2018.
Liquidity Ratios
Liquidity ratios have improved significantly over the years from the 0.55c per dollar to $1.08 per dollar of liabilities. This is a strong turn around and seems to be the only positive aspect in the ratios that has come from the merger. Having fewer current liabilities to current assets is promising however, I wonder if it might be attributed to the fact that the other companies that have come together under the merger carried more current assets over current liabilities. As, the merger saw 2 large companies come together and then buy or merge a lot of smaller companies underneath the ARQ Group, it is still too early to see if this is the case. It is highly likely that the smaller companies maybe have been in liquidation or not doing as well alone as they would under the ARQ Group.
Financial Structure Ratios
The financial structure ratios showed that the company holds a lot of debt in total liabilities, in relation to their assets it was almost consistent with over 100% debt. This was quite consistent throughout the last four years, with 2016 being the only year without over 100% debt. However, considering that the current assets to current liabilities ratio has improved to over 100%, Melbourne IT seems to be making improvements. Considering that the Liquidity ratios have improved significantly since the merger, it could simply be attributed to less current liabilities. Equity/total assets and Debt/total assets were almost even across all years, sitting at around 50/50 both ways, which isn’t the best, but the debt has improved from the 54% it was at in 2015 to 51% in 2018. Again, the lower liabilities in 2018 would be because of the lower current liabilities from the merger.
As Net Profit is down radically in 2018, it is not surprising that the earnings per share ratio was also down from 0.12 in 2017, to -0.02 in 2018, as the ARQ Group merger has combined in the ASX there are many factors that could be affecting this. On the other hand, the dividends paid out per share increased slightly and Melbourne IT seems to be trying to placate any uncertainty felt by their shareholders since the new merger, with increased dividend returns. The market price per share over the earnings per share has fluctuated, this could be due to share prices fluctuating, as the net profit over the number of shares remained steady for both 2016 and 2017. 2018 saw a staggering drop to (-180) from 23.61, indicating that the investment would be paid back in less than one year as opposed to the 23 years prior. This is a stark contrast to the decreased profit as a result of the ARQ Group merger in 2018.
Restated Ratios
Comprehensive income over shareholders’ equity was positive and like all the other items in the ratios, seemed to be getting better, in fact in 2015 the Return on Equity was at just 5% but increased to over 8% in both 2016 and 2017, until 2018 where it dropped to -1.43%. This is most likely because the profit for the year of 2018 was -2,326 and possibly due to the acquisition of the other groups under the merger, Outware and WME for example. Return on Net Operating Assets is down slightly from all the other years in the financial statements indicating that the Operating Income is still higher than the Net Operating Assets. In comparison to the Return on Assets from the original statements this is a much better outlook. It shows that Melbourne IT’s actual return on assets is much higher than previously indicated. Net Borrowing Cost ratio was significantly higher in 2018 at 13.53% the main driver behind this is the high amount of interest-bearing loans and the contingent consideration liabilities. In fact, most of the financial liabilities and obligations from 2018 can be the linked to the other companies taken under the merger. There were a lot of loans and debts accrued by these companies and the ARQ Group has had to acquire these. NFO from the restated financial statements is at 80k, where as NFE is (-10,825). 2017 was the best year for Net Borrowing Cost at 0.14%, exceptionally low cost, that would have benefitted the company. Melbourne IT’s Profit Margin is also down, but only slightly. The Profit Margin is still positive and considering the negative trend dominating 2018, this is positive. In comparison to the Net Profit Margin from the original financial statements, the positive percentage and the lesser drop from 2017, indicates that the company is doing better than previously apparent. Finally, the Asset Turnover. The Asset Turnover has followed a completely different trend to the entirety of the other ratios, except for the Current Ratio. Instead of becoming negative or less than previous years, the Asset Turnover that increased. It may have increased only slightly but considering all the other years and trends, this is seeming very beneficial, and indicates that sales and revenue have increased slightly. This could be a factor of the merge and simply due to an established base clientele and on-going contracts.
Economic Profit
Economic profit is a company’s revenue minus all the implicit and explicit costs involved in production. Explicit costs are those that are mostly unthought of but can be calculated, for example the cost of electricity to run the computers, the on-going maintenance costs for the computers and the rent on the company building. Explicit costs can be allocated a dollar amount and are easier to determine. An implicit cost is a little more difficult to calculate or to even comprehend. Also known as an implied cost, it is the opportunity cost accumulated when a business uses internal resources instead of explicit compensation. Or, in other words, it means the highest valued alternative that the company must sacrifice in order to produce something else. For example, the time spent manufacturing one product, that could be spent on a new project. Management will utilize explicit costs when reviewing a business’s operations, including profits; but will calculate implicit costs only for decision-making or choosing between multiple alternatives. For the average weighted cost of capital, I sifted through the financial statements and found a percentage to use. I am not entirely sure that I have found the correct figure, but it looked right to me. The fact that all of Melbourne IT’s economic profit is negative and worse in 2018 doesn’t bode well. Melbourne IT had a better year in 2016 but since the merger in 2018, has managed to increase the negative figure from 2017 by almost $6k. The higher negative for the economic profit in 2018 could very likely be attributed to the costs involved in the integration of the other lesser companies, like Outware and InfoReady. The implicit costs that could alter the economic profit, might be the time taken to complete the project, the other projects that would have been postponed and the management of any explicit costs accumulated by the businesses separately. The increased negative economic profit is not a good sign but likely due to the merger and it is too soon to determine if it will hinder the company in the long run.
In conclusion, the ratios show a different picture of Melbourne IT’s financial standing. For the most part in 2018 Melbourne IT is doing worse off than pervious years. however, since Melbourne IT’s finances were improving significantly in the years prior to the merge, it indicates a solid financial foundation and practices. After reading through the 2018 financial statements the customer contracts are down and the share price has also dropped. The uncertainty surrounding the merger is likely to blame. Revenue has increased by almost $100,000 in 2018, but EBITDA, dividends and underlying earnings per share have dropped. It is too early soon after the merger to determine the outcome of the company.
Step 9
As Melbourne IT recently merged under the ARQ Group, they have been looking to expand their software options by investing in some new projects. New software options will draw in a larger clientele base through different industries. For this assessment I will consider the two options, the first being facial recognition software and the second as real time bush fire mapping for the rural fire brigade. As these are all digital services there will be little in starting costs because it is highly likely that the company has the equipment and office space on hand already. However, because they are both projects that need to be developed over time, the negative costs initially will continue for longer. I assume these costs would include wages, licences and permits. I have decided on an initial investment and predicted that the residual value of these digital services would be higher than the initial investment because after stability, trust and reputation has been established, the software could be sold to another company or the highest bidder. For example, the bush fire-mapping would be incorporated by the rural fire brigade, but also receive incentives from the government for its development. As Melbourne IT is currently a smaller company that is in the process of expanding, I have also decided to use hundreds of thousands for the figures and maintain lower preliminary investments.
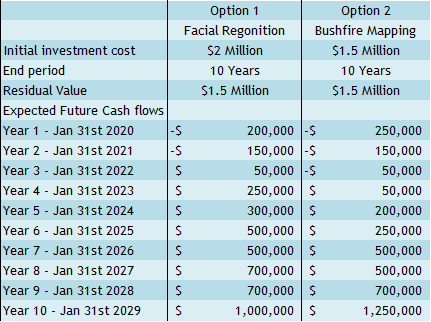
For my first chosen item, the facial recognition software I have chosen an initial investment of $2 million, mostly due to the equipment that may be needed for this specific type of software. As with any software projects it is unlikely to begin producing any income for quite some time, so I have opted to extend the negative figures for some years to allow for any software adjustments and developments, marketing and trust building that would be involved in getting a product out there. After a few years of negative amounts, it is highly likely that the software will be highly sought after and being to turn a profit quite quickly. Furthermore, I have also decided to have a high residual value at the end of the term due to the rarity and the value of developing new software such as this. It would be highly sought after and from what I can tell on the website, they are already developing something similar for ANZ and NAB in the coming years. This would bring in a high selling price at the end of the term. For the facial recognition, the NPV totalled to be $4.08 and the IRR is 12.3%, both are very promising figures. I have estimated that it would take around 8.07 years to payback the first investment and any subsequent costs involved in the development.
My second item of choice is the bush-fire mapping software. Like the facial recognition software, I have chosen to begin with more negative costs to begin with and to increase the profits quickly, this is because software like this is invaluable and would likely draw in government grants for development and more demand along the way. I have chosen a lesser starting investment of $1.5 million because it would require less equipment and legal protection. The bushfire mapping is also a prospective future project for the ARQ Group and like the facial recognition, is likely to hold a lot of residual value after the investment term is complete. The NVP for the bush fire mapping is $1.61 which is not as good as the facial recognition option, but it is still a positive amount and promising. The IRR totalled out to be 11.1%, which is just above the 10% discount rate and it would take 8.64 years to break even the initial investment.
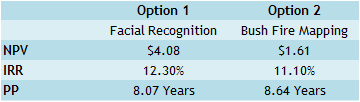
Overall the best option is for the facial recognition, even though it would cot more in the beginning, it would have a much higher return in the end. The NPV for the facial recognition option is much higher at $4.08 than the second option of just $1.64. The IRR for both options is close and over the discounted 10%, but the Facial Recognition is over 1% more. Likewise, both options have a similar payback period, with the Facial recognition getting paid off a few months sooner than the Bushfire Mapping. The facial recognition would hit the breakeven point earlier, would generate more profit overall and would sell for a higher amount when the investment term is complete. Of course, for investment decisions there would be a set time frame for the optimal payback period. The break-down of the primary investment cost, net present value (NPV), internal rate of return (IRR), and the payback period is a practical way for businesses to make constructive investment decisions for the future of the company.